Formula One 2021: Boxplotting Bahrain
Table of Contents
Lap-time Boxplots for the Top 5 Drivers
 Data retrieved from FIA Results & Statistics
Summary
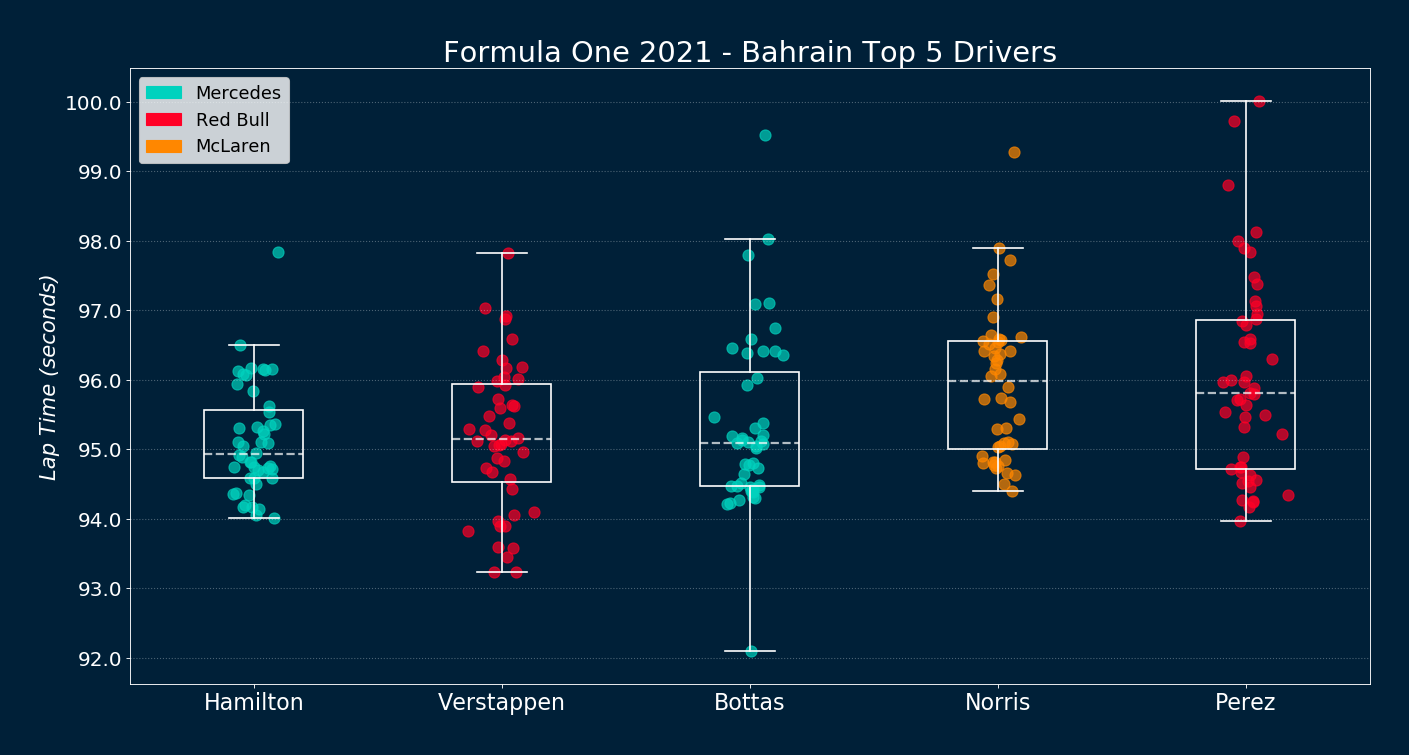
The 2021 Bahrain Grand Prix was race 1 of 23 in the 2021 Formula One World Championship . The course length is 5.412 km (3.363 mi), which after a total of 56 laps amounts to 302.826 km (188.167 mi). The dataset extracted for this analysis consists of all 56 lap times for the top 5 drivers in the race. The race was held on March 28th, 2021. Boxplots constitute a great way to visualize lap-time dispersion among drivers. The plot was done using matplotlib .
Commentary
There are a few interesting observations from the plot. Bottas had the fastest lap in the race at 92.09 seconds, but this blazing fast record was offset by too many laps above the 96-second mark. Similarly, Verstappen drove the fastest laps, with 9 of them coming in below the 94-second mark, but other slower laps increased his overall time. Meanwhile, Hamilton didn’t finish a single lap below the 94-second mark. However, his lap times had very low spread and were remarkably consistent—enough to earn him the first win of the 2021 season.
Data Preprocessing
Transforming Timestamps to Floats
Timesamps were originally given as strings (eg., Hamilton’s first lap is recorded as taking ‘1:59.538’). In order to make computation feasible all timestamps were converted to floats using the following function:
def str2seconds(cell_value):
    """Take a string timestamp and turn it into seconds (float, 3 decimals)"""
    time_list = cell_value.split(':')
    seconds = float(time_list[0])*60 + float(time_list[1])
    seconds = round(seconds, 3)
    return seconds
Removing Outliers
Proper outlier detection and removal is crucial to visualize this dataset. Given that the data is not normally distributed, techniques based on z-scores will either fail terribly or require heavy tweaking—like establishing the threshold for outliers at plus/minus 1 standard deviation, instead of the traditional plus/minus 3.
Another technique, the so-called Tukey’s fences, proved more fruitful. This method is based on the interquartile range (IQR) , and the formula is as follows:
\[{\big [}Q_{1}-k(Q_{3}-Q_{1}),Q_{3}+k(Q_{3}-Q_{1}){\big ]} \hspace{1.5cm} (1) \]
Where k is usually set to 1.5, and anything outside the interval is considered an ‘outlier’. It is important to note that we only want to get rid of large outliers (usually coming from slower first laps, accidents, safety cars on track, etc.). By contrast, small outliers are of extreme importance to determine the fastest laps by each driver—therefore we will keep them and ignore the left term of (1) during the removal procedure. The implementation is as follows:
def remove_outliers_iqr1p5(pseries):
    """Take a pandas series and return it without right-tailed outliers based
    on the 1.5IQR rule. Keep left-tailed outliers."""
    pseries_q1 = pseries.describe()['25%']
    pseries_q3 = pseries.describe()['75%']
    pseries_iqr_1p5 = (pseries_q3 - pseries_q1) * 1.5
    return pseries[pseries <= (pseries_q3 + pseries_iqr_1p5)]